Download
Software download
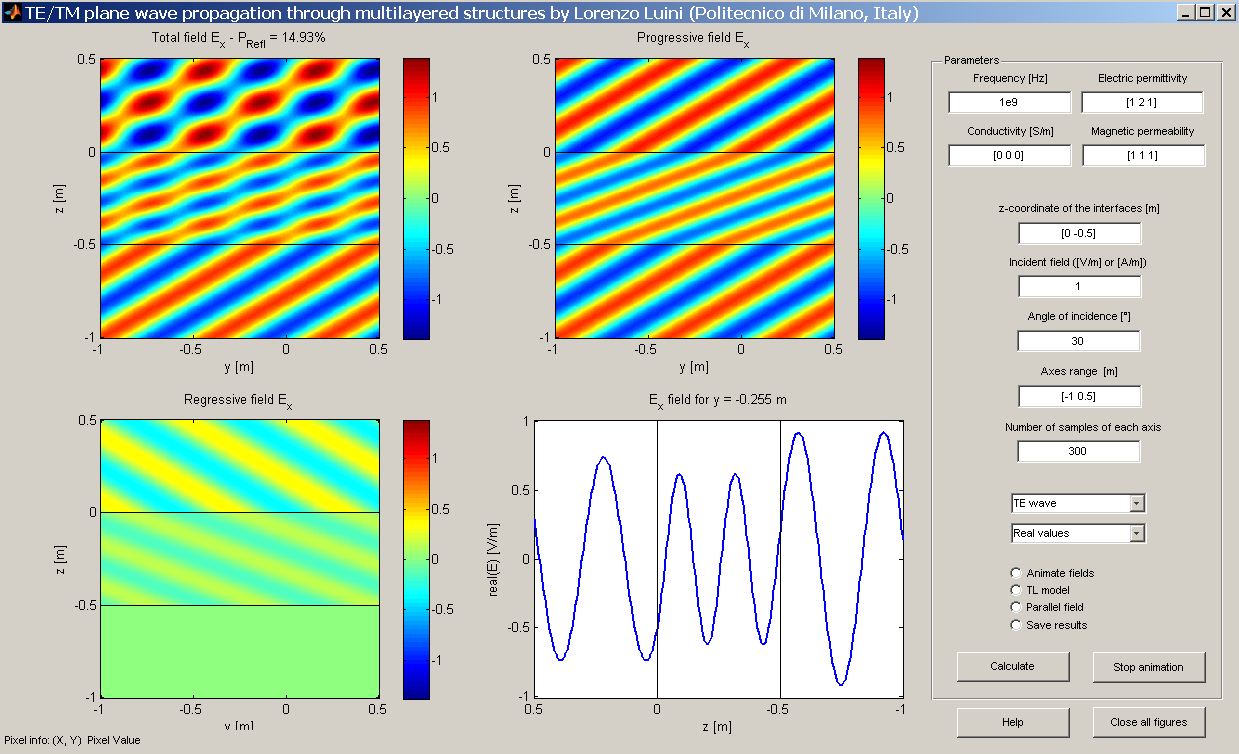
![]() Graphical User Interface for TE/TM electromagnetic plane waves propagation through multilayered structures
Graphical User Interface for TE/TM electromagnetic plane waves propagation through multilayered structures
This tool is a Graphical User Interface (GUI) for the analysis of the TE/TM plane waves propagation through structures composed by multiple layers with different electromagnetic characteristics. The GUI provides graphical results as well as detailed calculations of the transmission line equivalent circuit model. Also double-negative materials are supported. Take a look at the "Help.html" file included into the zip archive for a comprehensive description of the GUI features.
Platforms: Matlab (R2007a and following versions); Windows XP and Windows 7 (Matlab not needed; available upon request: send an email to This email address is being protected from spambots. You need JavaScript enabled to view it.)
![]() Magnetic dipole radiation through a multilayered structure
Magnetic dipole radiation through a multilayered structure
The function implements a horizontal magnetic dipole (along the x-axis) and calculates the x and z component of the magnetic field for y = 0. The script allows to set a wanted value of multiple layers, with their own relative electric permittivity, relative magnetic permeability, conductivity (see the LAYERS PARAMETERS section in the script). The script finally produces an animation of the radiated field.
Platforms: Matlab (R2007a and following versions)
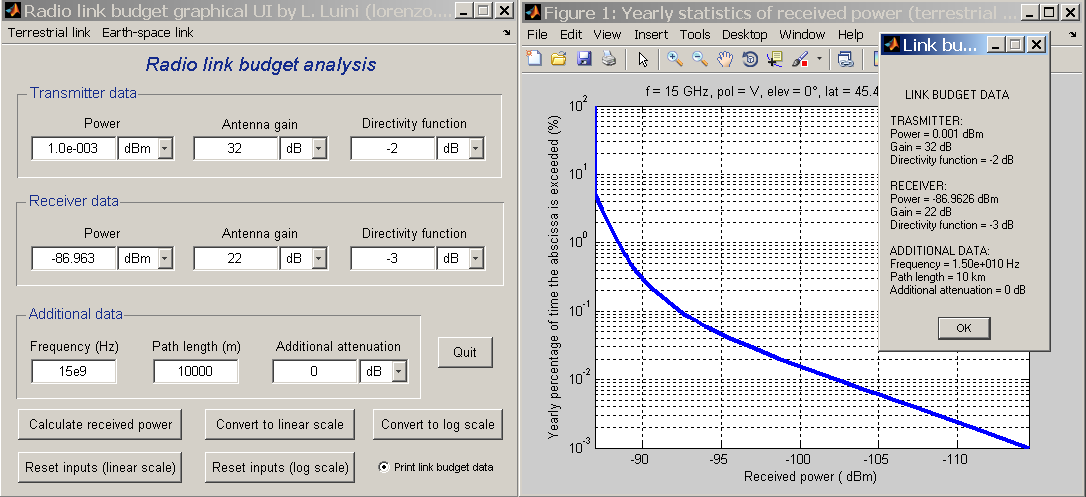
![]() Analysis tool for radio link budget
Analysis tool for radio link budget
A Graphical User Interface for the analysis of a radio link budget. It calculates the received power from the knowledge of the radio link characteristics. It allows to work in linear (e.g. Watts for the power) or in log (e.g. dBm for the power) scale (automatic conversion from one scale to the other is also possible). Effects of rain attenuation are considered both on terrestrial and Earth-space links.
Platforms: Matlab (R2007a and following versions); Windows XP and Windows 7 (Matlab not needed; available upon request: send an email to This email address is being protected from spambots. You need JavaScript enabled to view it.")
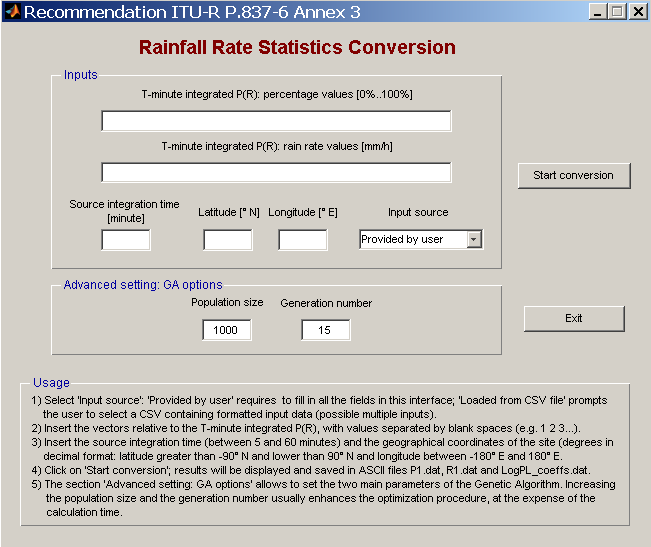
![]() Conversion of rainfall statistics from long to short integration time
Conversion of rainfall statistics from long to short integration time
A Graphical User Interface for the convesion of rainfall statistics (i.e. the Complementary Cumulative Distribution Function of the rain rate, also known as P(R)) from long (i.e. 5 to 60 minutes) to short (i.e. 1 minute) integration time. The application implements the algorithm published here (C. Capsoni, L. Luini, “A physically based method for the conversion of rainfall statistics from long to short integration time”, IEEE Transactions on Antennas and Propagation, vol. 57, no. 11, Page(s): 3692 – 3696, November 2009) and it has been recently adopted by the International Telecommunication Union - Radiocommunication Sector (ITU-R) in recommendation P.837-6 - Annex 3 ("Characteristics of precipitation for propagation modelling"). More information on the SW application (installation, user guide, data format, ...) is included in the ZIP file to be downloaded. For additional information, also refer to the text of recommedation ITU-R P.837-6.
Platforms: Matlab, Windows XP and Windows 7 (Matlab not needed; already included in the downloadable package)
![]() Fitting complex analytic laws to data by means of Genetic Algorithms
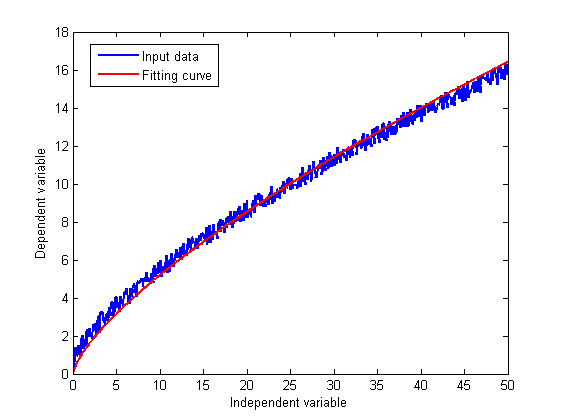
Fitting complex analytic laws to data by means of Genetic Algorithms
The script allows to easily fit predefined complex analytical laws exploiting the potentiality of Genetic Algorithms. The script receives as input the handle to the analytic laws to be fitted to data. Such law may depend on multiple variables and several parameters. This optimization approach may turn out to be particularly powerful when the number of variables and the number of parameters increases a lot.
Platforms: Matlab (R2007a and following versions); "Genetic Algorithm and Direct Search Toolbox" required
![]() Impedence/admittance transformations along transmission lines using the Smith Chart (by professor Carlo Riva)
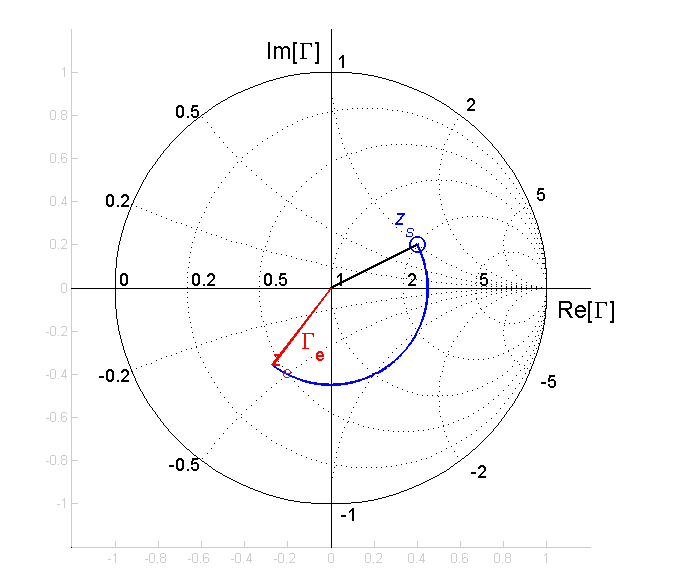
Impedence/admittance transformations along transmission lines using the Smith Chart (by professor Carlo Riva)
This tool implements impedence/admittance transformations along transmission lines by means of the Smith Chart. Results are provided in terms of target impedence/admittance and reflection/transmission coefficient. Graphical results, showing the movement on the Smith Chart, are provided as well.
Platforms: Matlab (R2007a and following versions)
![]() Real-time wave propagation along transmission lines (by professor Carlo Riva)
Real-time wave propagation along transmission lines (by professor Carlo Riva)
A Graphical User Interface simulating wave propagation along a transmission line in the time domain: power transfer and power loss, progressive and regressive waves, reflection and absorption phenomena.
Platforms: Matlab (R2007a and following versions)
![]()
![]() Use of the Smith Chart (by professor Carlo Riva)
Use of the Smith Chart (by professor Carlo Riva)
A simple yet comprehensive guide on the use of the Smith Chart (PDF version)
![]() Complete Smith Chart
Complete Smith Chart
The classic Smith Chart (high-resolution PDF file)